

SLO‑Driven Automation: Closing the Loop from Alerts to Fixes
We had a 99.9% availability SLO for the API gateway. When it breached, we paged an engineer. And when the engineer showed up — bleary-eyed, possibly at 2am — the first three minutes were always identical. Check the error rate in Grafana. Check which pods were unhealthy. Restart the unhealthy pods. Every time. Same alert, same three steps, same outcome.
Think about what that actually means. A human being was pulled away from sleep to perform a task that had no variation. No judgement required. No creative problem-solving. Just: check, check, restart. The same three steps that a script could do in ten seconds.
That's the thing about mechanical work — it wears people down in a way that creative incidents don't. It's not just the lost sleep. It's the knowledge that you could have slept, because nothing you did tonight required you to be human.
SLO-driven automation is about drawing that line clearly: these remediations are always the same, so they happen without a person. Anything that isn't — anything that needs actual judgement — still pages a human. For the triage layer that runs before remediation kicks in — context gathering and structured summaries for on-call engineers — see AI Incident Triage.

Quick takeaways
- Not all SLO breaches need the same response — classify first, act second, always
- Safe remediations are small, targeted, and reversible. If it's not all three, it needs a human
- Destructive actions — drain, delete, scale to zero — always require human approval, no exceptions
- The automation loop should shrink MTTR. If it's creating new incidents, something in the catalogue is wrong
The catalogue is the governance layer
The remediation catalogue is where you make decisions in advance, in daylight, without pressure. Every action in it has been reviewed by a human who was not on-call and stressed. That's exactly when you want policy decisions made.
The classification problem
Here's the version of SLO automation you don't want: it triggers on any breach and applies a fixed response. That breaks in two ways. Benign breaches — traffic spike that resolves itself, a flapping probe — get unnecessary interventions that might make things worse. And unusual breaches, the kind that actually need thought, get the wrong treatment because they look like the common case.
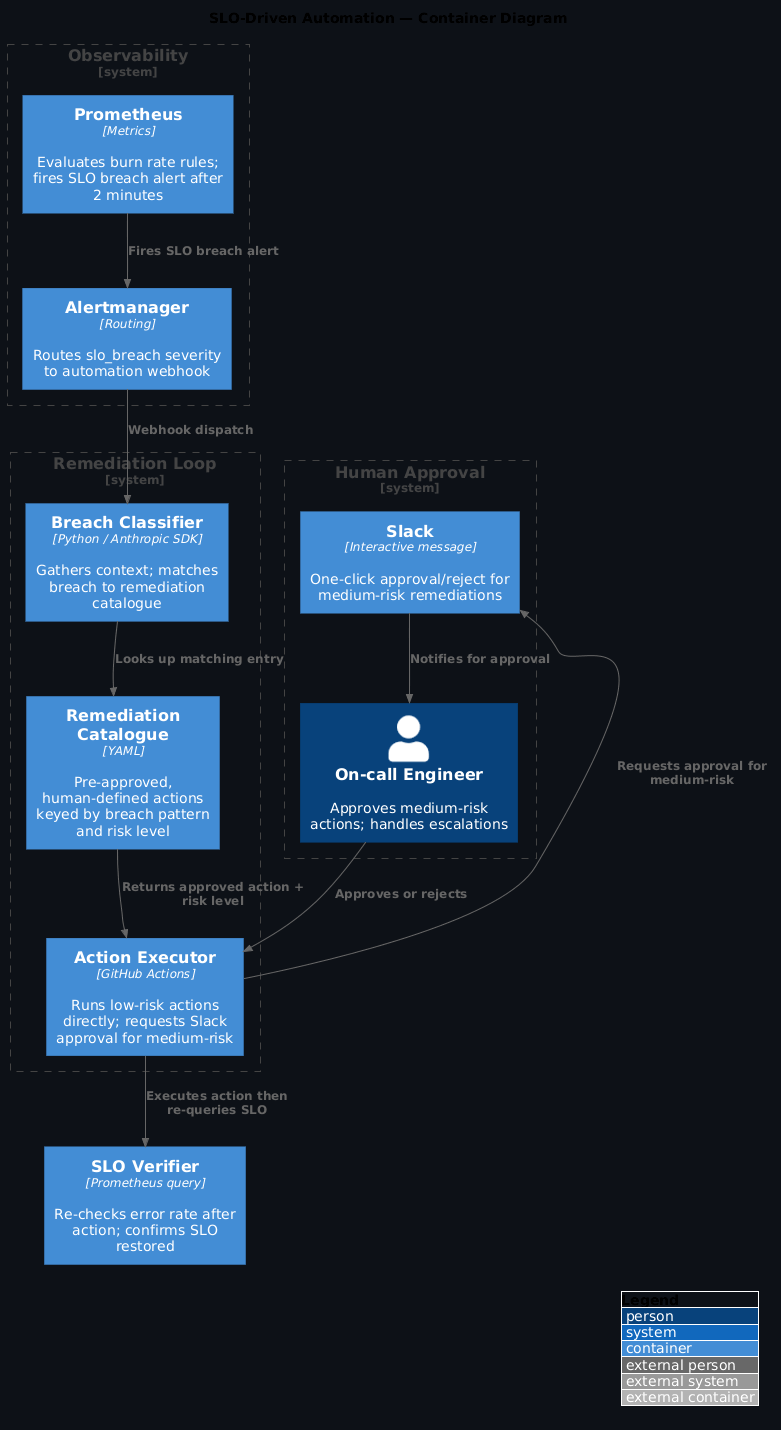
The safe version classifies before it acts:
SLO breach alert
        ↓
Gather: error rate, latency p95, healthy pod count, recent deploys, upstream status
        ↓
Classify: what category of breach is this?
        ↓
Category → approved remediation catalog
        ↓
Approved catalog entry → execute (or escalate if not in catalog)
The catalogue is everything. It's a list of pre-approved, human-defined responses to specific, recognisable conditions. The agent doesn't invent remediation — it matches conditions to what's been explicitly approved. If there's no match, it escalates. It doesn't improvise.
No catalogue match = escalate, not improvise
If the breach doesn't match any catalogue entry, the system must escalate to a human — not attempt a best-guess remediation. An improvised fix to an unrecognised breach pattern is how automation creates cascading incidents. The catalogue is your guarantee that only reviewed actions run automatically.
1) The SLO breach alert
# prometheus/rules/slo-breach.yml
groups:
  - name: slo-breach
    rules:
      - alert: APIGatewayAvailabilityBreached
        expr: |
          (
            sum(rate(http_requests_total{status=~"5..", service="api-gateway"}[5m]))
            /
            sum(rate(http_requests_total{service="api-gateway"}[5m]))
          ) > 0.001
        for: 2m
        labels:
          severity: slo_breach
          service: api-gateway
          slo: availability
        annotations:
          summary: "API gateway error rate above 0.1% for 2 minutes"
          runbook: "https://runbooks.internal/api-gateway-slo"
Route SLO breach alerts to a dedicated webhook that kicks off the automation loop — keeping them separate from your general alerting so the routing logic stays clean:
# alertmanager/config.yml
route:
  routes:
    - match:
        severity: slo_breach
      receiver: slo-automation
      group_wait: 30s
      group_interval: 5m

receivers:
  - name: slo-automation
    webhook_configs:
      - url: "https://api.github.com/repos/ORG/REPO/dispatches"
        http_config:
          authorization:
            credentials: "${GITHUB_TOKEN}"
        send_resolved: false
Apply this: separate routing for SLO breaches
Route slo_breach severity to its own receiver rather than mixing it with general PagerDuty alerts. Keeping the routing logic separate means you can tune group_wait and group_interval specifically for automation — without affecting how urgent alerts reach on-call engineers.
2) The remediation catalogue
The catalogue is where you do the thinking in advance, not in the middle of an incident. Each entry defines what the condition looks like and exactly what action is allowed — no more, no less:
# remediation/catalog.yaml
remediations:
  - id: restart-unhealthy-pods
    description: "Restart pods that have been in CrashLoopBackOff for >3 minutes"
    condition:
      service: "any"
      pattern: "pods in CrashLoopBackOff"
      min_healthy_ratio: 0.5  # at least 50% of pods must be healthy before restarting
    action:
      type: kubectl
      command: "kubectl rollout restart deployment/{service} -n {namespace}"
      risk: low
      reversible: true
      rollback: "kubectl rollout undo deployment/{service} -n {namespace}"

  - id: scale-up-api-gateway
    description: "Scale up API gateway when CPU is sustained >85% for 5 minutes"
    condition:
      service: "api-gateway"
      pattern: "high CPU sustained"
      max_replica_increase: 3  # never more than +3 replicas per action
    action:
      type: kubectl
      command: "kubectl scale deployment/api-gateway --replicas={current+2} -n platform"
      risk: low
      reversible: true
      rollback: "kubectl scale deployment/api-gateway --replicas={original} -n platform"

  - id: clear-redis-cache
    description: "Flush Redis cache when cache hit rate drops below 20%"
    condition:
      service: "cache"
      pattern: "low cache hit rate"
    action:
      type: script
      command: "scripts/flush-redis-cache.sh {redis_host}"
      risk: medium
      reversible: false
      requires_approval: true  # medium risk = needs Slack approval
The rule is simple: if it's not in the catalogue, the agent doesn't run it. Full stop. It escalates to a human instead. That boundary is what makes the automation trustworthy.
3) The automation workflow
# .github/workflows/slo-remediation.yml
name: SLO Remediation

on:
  repository_dispatch:
    types: [slo-breach]

jobs:
  classify-and-remediate:
    runs-on: ubuntu-latest
    steps:
      - uses: actions/checkout@v4

      - name: Gather breach context
        id: context
        env:
          PROMETHEUS_URL: ${{ secrets.PROMETHEUS_URL }}
          ALERT_PAYLOAD: ${{ toJson(github.event.client_payload) }}
        run: python scripts/gather-breach-context.py

      - name: Classify breach and match catalog
        id: classify
        env:
          ANTHROPIC_API_KEY: ${{ secrets.ANTHROPIC_API_KEY }}
          CATALOG_FILE: remediation/catalog.yaml
          CONTEXT_FILE: /tmp/breach-context.json
        run: python scripts/classify-and-match.py

      - name: Execute low-risk remediation
        if: steps.classify.outputs.risk == 'low'
        env:
          KUBECONFIG: ${{ secrets.KUBECONFIG_STAGING }}
          REMEDIATION: ${{ steps.classify.outputs.remediation }}
        run: python scripts/execute-remediation.py

      - name: Request approval for medium-risk
        if: steps.classify.outputs.risk == 'medium'
        env:
          SLACK_BOT_TOKEN: ${{ secrets.SLACK_BOT_TOKEN }}
          REMEDIATION: ${{ steps.classify.outputs.remediation }}
        run: python scripts/request-approval.py

      - name: Escalate if no catalog match
        if: steps.classify.outputs.matched == 'false'
        env:
          PAGERDUTY_KEY: ${{ secrets.PAGERDUTY_KEY }}
          CONTEXT_FILE: /tmp/breach-context.json
        run: python scripts/escalate-to-human.py
Apply this: the three paths
Every breach takes one of three paths: low-risk catalogue match → execute automatically; medium-risk catalogue match → Slack approval button; no catalogue match → escalate to human via PagerDuty. Build the workflow to be explicit about which path was taken — log it every time so you can audit the split over time.
4) What good and bad look like
Let me be concrete about this, because the line matters.
Good use of SLO automation: - Restarting pods in CrashLoopBackOff when healthy replicas are still serving traffic — contained, reversible, fast - Scaling up a deployment when CPU has been sustained high and the load pattern is predictable - Flushing a cache when hit rate drops and it's genuinely safe to take the miss penalty - Clearing a stuck job queue when the consumer is the problem, not the queue
Wrong use of SLO automation: - Draining nodes during a breach — too broad, blast radius is enormous - Rolling back a deployment automatically — requires human judgement about what caused it - Scaling to zero — this is almost never the right call, and when it's wrong it's catastrophic - Anything that could cascade into dependent services that aren't part of the current breach
The catalogue forces this conversation before anyone is on-call and stressed. That's the whole point — decisions made at 2pm on a Tuesday are better than decisions made at 2am during an incident.
Scale to zero is never a catalogue entry
No matter how confident the classification, scaling a deployment to zero should never be an auto-approved catalogue action. The blast radius when it's wrong — zero instances serving traffic — is too severe. If something needs to be scaled to zero, that's a human decision.
Measuring whether it is working
MTTR is one of the four DORA metrics that DevEx Metrics That Matter shows you how to collect and track automatically.
Three numbers tell you whether this is actually working:
- MTTR before vs after: the primary question. Is remediation faster? If it isn't, something's wrong — either the catalogue is matching the wrong conditions, or the actions aren't actually fixing anything.
- False positive rate: automation ran, incident resolved by itself, automation made no real difference. This one's subtle — a high false positive rate means your matching conditions are too loose, and you're burning resources on remediations that weren't needed.
- Escalation rate: what percentage of SLO breaches had no catalogue match and had to go to a human anyway? A high escalation rate means your catalogue is too narrow, and you're not actually automating the cases you thought you were.
Read all three together. MTTR down, false positive rate low, escalation rate decreasing over time — that's the system working. Any of them trending the wrong way tells you where to look.
Frequently asked questions
What is SLO-driven automation?
It's the practice of triggering remediation actions automatically when a service level objective is breached, instead of waking a human up to do something mechanical. The key constraint — and what makes it trustworthy rather than terrifying — is the pre-approved remediation catalogue. Only actions that have been explicitly reviewed and listed as safe can run without human approval. The automation doesn't get to improvise.
How do you prevent automated remediation from making things worse?
Two controls working together. First, the catalogue — if an action isn't in it, it doesn't happen, full stop. Second, a confidence threshold on the classification: if the breach doesn't clearly match a catalogue entry, the system escalates to a human rather than guessing. And medium-risk remediations always require a human to approve in Slack before anything runs. The automation handles the obvious cases; humans handle everything else.
What actions are safe to automate when an SLO breaches?
Think in terms of three properties: reversible, well-understood, low blast radius. Restarting an unhealthy pod — yes. Scaling up a deployment under predictable load — yes. Clearing a cache, flushing a connection pool — yes. Anything that modifies configuration, changes routing, rolls back a deployment, or touches a database — no. Those need human eyes, because the cause isn't clear from the breach signal alone.
How do you measure whether SLO automation is actually reducing MTTR?
Track three things: MTTR before and after (the primary outcome — if this isn't improving, something's wrong), false positive rate (automations that fired but made no real difference — tells you your matching conditions are too loose), and escalation rate (breaches that had to go to a human anyway — tells you your catalogue is too narrow). All three together give you an honest picture.
How do you keep the remediation catalogue from going stale?
Review it quarterly in a non-incident context. For each entry: is the condition description still accurate? Has the action been used in the last quarter? Did it actually fix the problem when it ran? Remove entries that never match, update ones where the underlying service has changed, and add entries for new patterns you've seen in postmortems. A stale catalogue is worse than no catalogue — it creates false confidence.
What you get
- Repeatable, mechanical remediations happen in under 2 minutes instead of 15 — no one gets paged for a CrashLoopBackOff at 3am
- The catalogue is a documented, versioned list of approved actions — decisions made in daylight, not under pressure
- Novel incidents still page humans. Boring ones don't. That's the line you actually want
- Every remediation action is logged with the full breach context that triggered it — useful for postmortems, useful for refining the catalogue
Walkthrough files
prometheus/rules/slo-breach.yml— SLO breach alert rule with 2-minute burn ratealertmanager/config.yml— route SLO breaches to the automation webhookremediation/catalog.yaml— pre-approved remediation catalogue definitions.github/workflows/slo-remediation.yml— classification and execution workflowscripts/classify-and-match.py— AI classification with catalogue lookupscripts/execute-remediation.py— safe execution with audit logging
For the triage layer that runs upstream of remediation — the part that gathers context and produces structured summaries before any action is taken — see AI Incident Triage.