MCP Servers in Kubernetes: The ToolHive Operator


It's 11pm and you're copy-pasting the same JWT validation middleware into your fourth MCP server this month. The first one took a while to get right — figuring out token expiry, getting the scope checks in the right order, making sure the audit log fired even on errors. The second was mostly copy-paste. Third was definitely copy-paste. And now here you're doing it again, and somewhere in the back of your head you know that if you ever need to change something about how auth works, you're going to have to find it in four different places.
Sound familiar? That's the pattern MCP servers fall into without an operator. You roll the security layer once, it works, then you roll it again for the next server, and again, and the fleet grows and the bespoke middleware accumulates and one day a CVE means you're patching four codebases at 7am.
MCP in the Real World covered the code patterns you need — JWT validation, per-tool permission scoping, structured audit logging, prompt injection defences. All of that is genuinely necessary. But you shouldn't have to write it for every server.
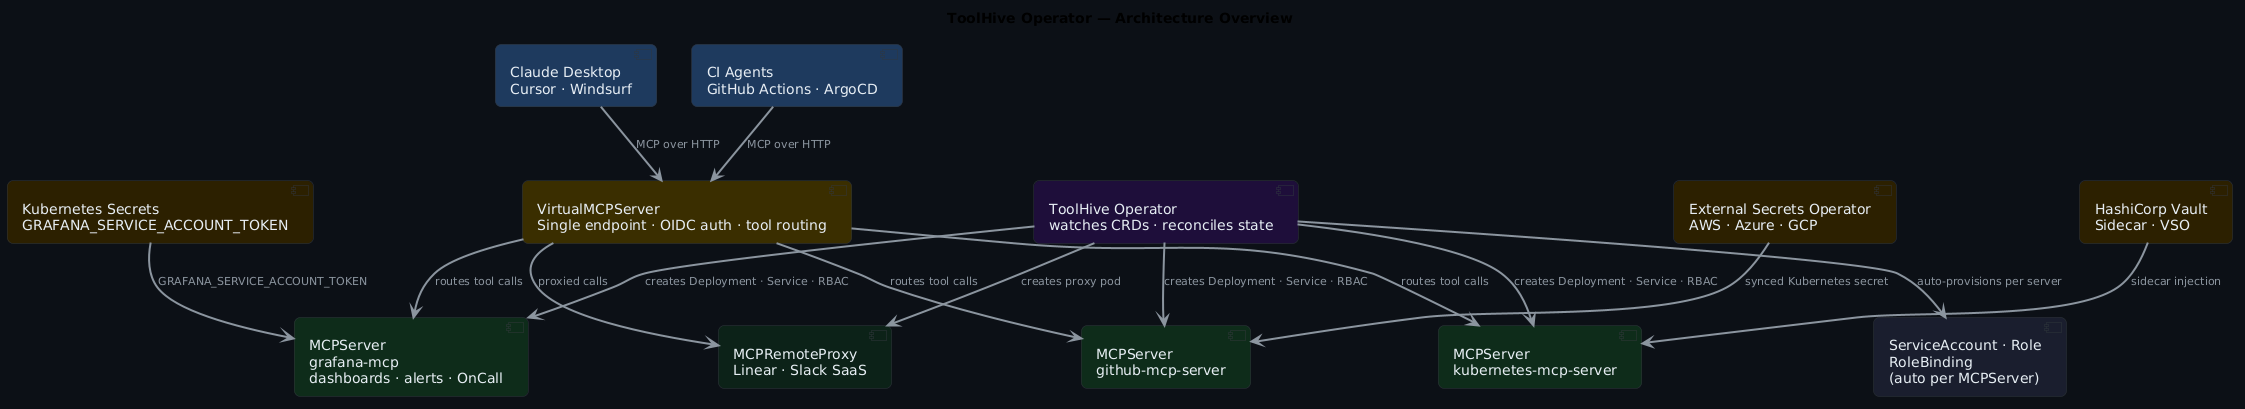
The ToolHive Kubernetes operator is the answer to that problem. You declare an MCPServer resource. The operator creates the Deployment, Service, ServiceAccount, Role, and RoleBinding. Auth, secret injection, and lifecycle management are configured in YAML once, not reimplemented in code repeatedly.
Quick takeaways
- Declare an
MCPServerCRD — the operator auto-provisions RBAC (ServiceAccount, Role, RoleBinding) per server, no configuration required - Secret injection from Kubernetes secrets, External Secrets Operator, or Vault — works with whatever your team already uses
- Two Helm commands to install. CRDs ship separately so you can upgrade them independently
VirtualMCPServeraggregates your whole fleet behind one endpoint with centralised OIDC authMCPRemoteProxybrings external SaaS MCP endpoints into the same management model- The operator API is
v1beta1as of May 2026 — stable enough to run, worth pinning chart versions
What ToolHive actually is
ToolHive is a platform from Stacklok for running and managing MCP servers. Stacklok is the company Craig McLuckie co-founded after leaving Google's Kubernetes team — so the operator patterns are unsurprisingly well-considered. ToolHive comes in a few forms: a CLI (thv) for local use, a UI, and the Kubernetes operator for cluster deployments.
The operator is what matters for platform teams. In practice it means this: you write a YAML file describing your MCP server, apply it, and the operator creates the Deployment, Service, ServiceAccount, Role, and RoleBinding — you don't touch any of them. Auth, secret injection, and lifecycle management are handled at the operator level, not reimplemented per server.
Under the hood, it introduces a handful of Custom Resource Definitions into your cluster:
MCPServer— a containerised MCP server running in the clusterMCPRemoteProxy— a proxy to an MCP server hosted outside the clusterMCPServerEntry— a lightweight catalog entry for vMCP discovery (no proxy pod)VirtualMCPServer— multiple servers aggregated behind a single endpoint
There are shared config CRDs too — MCPOIDCConfig, MCPToolConfig, MCPTelemetryConfig — that you reference from server resources rather than repeating inline. The whole thing is designed around reuse and composition.

Getting it running
Two Helm commands. CRDs install separately — this matters because CRD upgrades sometimes have breaking changes and you want to control timing independently of the controller upgrade.
# Step 1: CRDs
helm upgrade --install toolhive-operator-crds \
  oci://ghcr.io/stacklok/toolhive/toolhive-operator-crds \
  -n toolhive-system --create-namespace

# Step 2: Operator controller
helm upgrade --install toolhive-operator \
  oci://ghcr.io/stacklok/toolhive/toolhive-operator \
  -n toolhive-system --create-namespace
Both charts are public OCI artefacts from ghcr.io. No webhook setup, no cert-manager dependency, no CRD patching. After about thirty seconds:
kubectl get pods -n toolhive-system
# NAME                               READY   STATUS    AGE
# toolhive-operator-7d9f8c6b-xkp2m   1/1     Running   45s

kubectl get crd | grep toolhive
# mcpservers.toolhive.stacklok.dev         2026-05-15T10:00:00Z
# mcpremoteproxies.toolhive.stacklok.dev   2026-05-15T10:00:00Z
# virtualmcpservers.toolhive.stacklok.dev  2026-05-15T10:00:00Z
No cert-manager dependency
Unlike many operators, ToolHive doesn't require cert-manager or webhook certificate setup. The install is genuinely two commands. If your cluster policies around CRD installation are strict, the separate CRD chart gives you the control you need without fighting the operator install process.
Your first MCPServer
Let's use Grafana's MCP server as the example. It's a server most platform teams will actually want — it exposes Grafana dashboards, Prometheus queries, Loki log searches, alert rules, OnCall schedules, and incident management as MCP tools. Once it's running, you can ask Claude things like "what alerts are firing right now?" or "show me the p99 latency for the payments service over the last hour" and get actual answers backed by your Grafana instance.
Here's the payoff up front: one YAML file, one kubectl apply, and the operator creates seven Kubernetes resources automatically. You don't write a Deployment, a ServiceAccount, a Role, or a RoleBinding. They just appear.
First, create a Grafana service account token and store it as a Kubernetes secret:
# Create the secret in your MCP fleet namespace
kubectl -n platform-tools create secret generic grafana-token \
  --from-literal=token=<YOUR_GRAFANA_SERVICE_ACCOUNT_TOKEN>
Then declare the MCPServer:
# mcp-servers/grafana.yaml
apiVersion: toolhive.stacklok.dev/v1beta1
kind: MCPServer
metadata:
  name: grafana
  namespace: platform-tools
spec:
  image: grafana/mcp-grafana:latest
  transport: streamable-http
  mcpPort: 8000
  proxyPort: 8080
  env:
    - name: GRAFANA_URL
      value: "https://your-grafana.internal"
  secrets:
    - name: grafana-token
      key: token
      targetEnvName: GRAFANA_SERVICE_ACCOUNT_TOKEN
  resources:
    limits:
      cpu: '200m'
      memory: '256Mi'
    requests:
      cpu: '50m'
      memory: '128Mi'
Apply it and watch what happens:
kubectl apply -f mcp-servers/grafana.yaml
kubectl -n platform-tools get mcpservers

# NAME      STATUS    URL                                            AGE
# grafana   Running   http://mcp-grafana-proxy.platform-tools:8080  42s
What the operator actually created behind the scenes: a Deployment running a ToolHive proxy container, a headless Service for backend pod communication, a ServiceAccount named grafana, a Role with minimal permissions, and a RoleBinding connecting them. You didn't write any of that. The Grafana token stays in the Kubernetes secret and gets injected as an env var directly into the MCP server pod — the proxy never sees it.
The RBAC auto-provisioning is the feature people underestimate
You saw it happen in the Grafana example — no RBAC manifest, no ServiceAccount definition, just an MCPServer resource and the operator handled it. That's not just convenient. It's a security property.
When teams run multiple MCP servers without an operator, the pattern that emerges is one broad ServiceAccount shared across everything because setting up individual RBAC per server is fiddly. One broad ServiceAccount means if anything goes wrong with one server, the blast radius is everything that ServiceAccount can touch.
Least privilege as the path of least resistance
ToolHive makes least-privilege the default. Each MCPServer automatically gets its own ServiceAccount with exactly the permissions the proxy needs to manage that server's pods. Nothing shared. And because it's automated, it doesn't get skipped because you were rushing — the security property is enforced by the operator, not by human discipline.
For multi-tenant clusters, this matters even more. When you're running MCP servers for different teams in different namespaces, you really don't want cross-namespace bleed from a misconfigured ServiceAccount.
Getting secrets in without touching the proxy
The Grafana MCPServer above showed the pattern already — but it's worth being explicit about what's happening and why it's designed that way.
The important detail: secrets are injected directly into the MCP server pod as environment variables. The proxy layer never sees them. This matters because the proxy is the thing handling auth, rate limiting, and tool dispatch — you don't want Grafana tokens, GitHub PATs, or cloud API keys sitting in the same process that's also validating JWTs and writing audit logs.
Kubernetes secrets are the simplest path. You already saw this with Grafana's GRAFANA_SERVICE_ACCOUNT_TOKEN. Same pattern applies to any other MCP server:
secrets:
  - name: grafana-token
    key: token
    targetEnvName: GRAFANA_SERVICE_ACCOUNT_TOKEN
  - name: github-token
    key: token
    targetEnvName: GITHUB_PERSONAL_ACCESS_TOKEN
External Secrets Operator (for teams syncing from AWS Secrets Manager, Azure Key Vault, or GCP Secret Manager): your MCPServer definition looks identical to the Kubernetes-native example. ESO syncs the secret from the external source into a Kubernetes secret, and ToolHive picks that up. No special integration needed.
HashiCorp Vault: ToolHive supports the Vault Secrets Operator (which also produces standard Kubernetes secrets) and the Vault Sidecar Agent Injector via annotations in podTemplateSpec. Whichever method your team uses for other workloads works here too.
Apply this: no new secret management to learn
You don't need to change how you manage secrets across the rest of your platform. ToolHive slots into whatever's already there. If your Grafana token is managed in Vault and ESO is already syncing it into the cluster, you just point the secrets block at the resulting Kubernetes secret.
How the operator actually reconciles
It helps to understand the full flow — what happens between you applying an MCPServer YAML and your AI client getting a response from it.

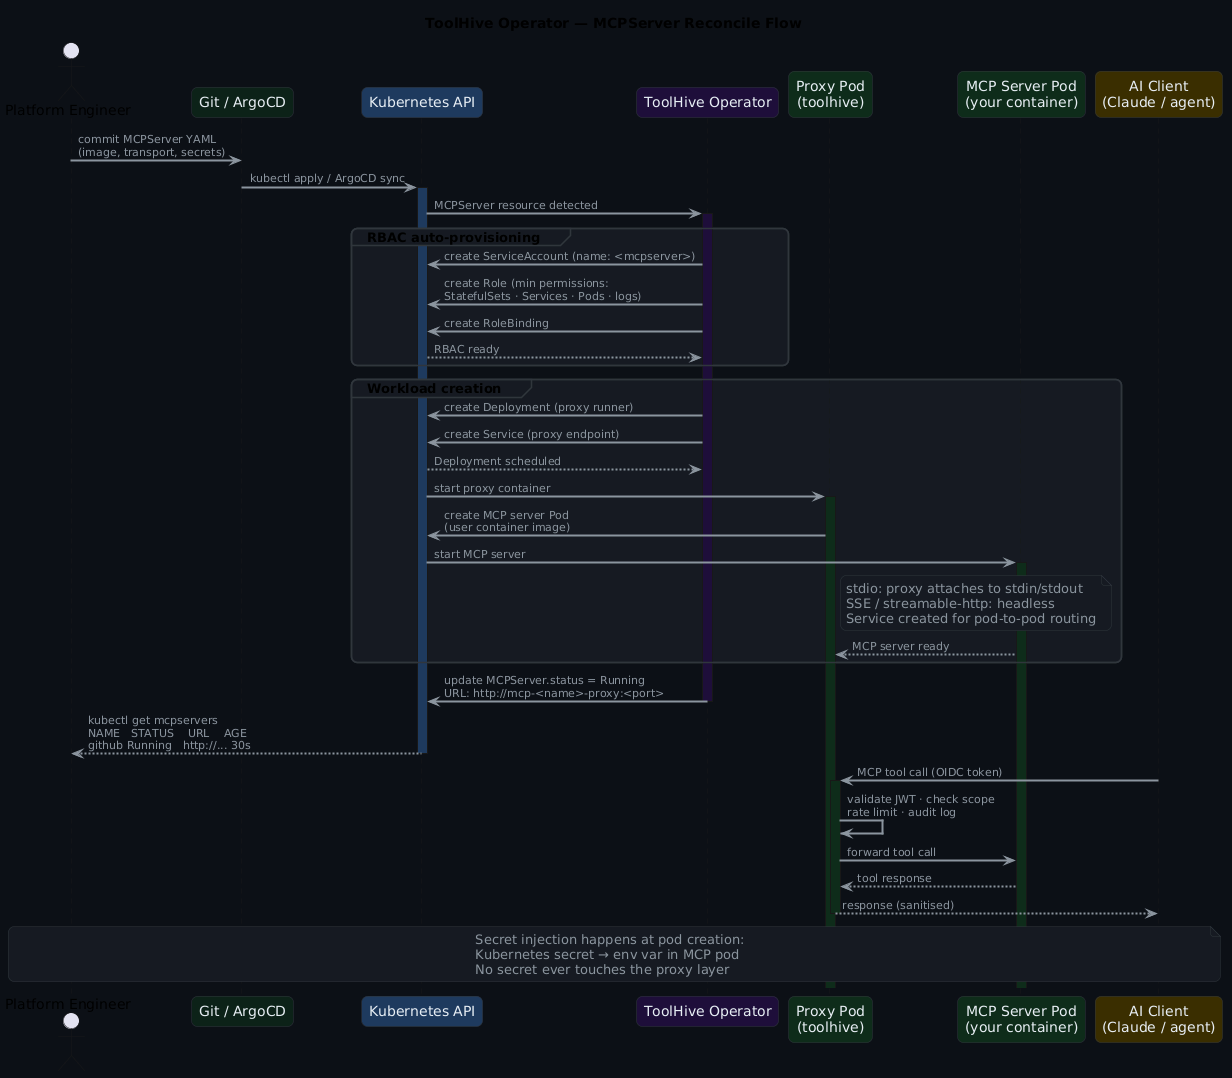
The proxy pod sits in front of every MCP server. It handles: OIDC token validation, scope checking (which tools this caller can invoke), rate limiting, and structured audit logging. Tool calls that pass all of those checks get forwarded to the MCP server pod. Responses come back through the proxy — which means you get a consistent auth and audit model across your whole fleet regardless of what each individual MCP server does or doesn't implement.
Transport: stdio vs SSE vs streamable-http
Worth knowing before you deploy at scale, because the choice affects what you can and can't do with replicas.
stdio runs the MCP server as a subprocess attached to the proxy's stdin/stdout. Simple, no extra networking setup. The constraint: a single client connection at a time, and backendReplicas must be 1. Fine for personal tools or low-concurrency use cases.
streamable-http (or sse) creates a headless Service and routes HTTP traffic to backend pods. Multiple concurrent clients. Horizontally scalable. This is what you want for anything used by more than one person or any server you might want to scale under load.
MCP connections are stateful — Redis is not optional when scaling
When backendReplicas > 1, Redis is how the proxy runner knows which backend pod owns each session. Without Redis, Kubernetes ClientIP affinity is unreliable behind NAT and you'll see mysterious session routing failures. If you're planning to scale any streamable-http server beyond one replica, wire up Redis from the start.
Multi-tenant: namespace mode
By default the operator watches all namespaces — appropriate for a single-tenant platform cluster or a trusted internal environment. For multi-tenant setups you want namespace mode, which restricts the operator to an explicit allowlist:
# values.yaml
operator:
  rbac:
    scope: 'namespace'
    allowedNamespaces:
      - 'platform-tools'
      - 'team-frontend'
      - 'team-backend'
      - 'production'
helm upgrade --install toolhive-operator \
  oci://ghcr.io/stacklok/toolhive/toolhive-operator \
  -n toolhive-system -f values.yaml
The operator creates RoleBinding resources in each allowed namespace rather than a ClusterRoleBinding. MCPServer resources outside the allowlist are simply ignored. If a team tries to deploy an MCPServer in a namespace that isn't in the allowlist, nothing happens. The operator doesn't error, it just doesn't reconcile it. That's the right behaviour.
Proxying external SaaS tools with MCPRemoteProxy
Not every useful MCP server runs in your cluster. Linear has an MCP server. GitHub's MCP server can run externally. Various SaaS platforms are adding MCP endpoints. MCPRemoteProxy lets you bring those into the same management model — same auth layer, same audit logging — without running the server yourself:
apiVersion: toolhive.stacklok.dev/v1beta1
kind: MCPRemoteProxy
metadata:
  name: linear
  namespace: platform-tools
spec:
  url: https://mcp.linear.app/mcp
  proxyPort: 8080
The operator creates a proxy pod that applies your standard auth and audit layer to calls destined for the external endpoint. Your agent clients talk to the proxy; the proxy manages the external connection. Operationally consistent with in-cluster servers.
VirtualMCPServer: one endpoint for the whole fleet
When you're running five or more MCP servers and your agents are maintaining five separate connections, VirtualMCPServer aggregates everything behind a single endpoint. The agent authenticates once and sees one server; vMCP routes tool calls to the right backend.
This is also where centralised auth lands. Configure OIDC once on the VirtualMCPServer — an MCPOIDCConfig reference — and all backends inherit it:
apiVersion: toolhive.stacklok.dev/v1beta1
kind: VirtualMCPServer
metadata:
  name: platform-tools-vmcp
  namespace: platform-tools
spec:
  backends:
    - name: grafana
      namespace: platform-tools
    - name: github
      namespace: platform-tools
    - name: linear
      namespace: platform-tools
  proxyPort: 9090
Your agent now connects to one endpoint and can query Grafana dashboards, open GitHub issues, and update Linear tickets — all through a single authenticated connection.
# See everything ToolHive is managing
kubectl get toolhive -n platform-tools

# NAME                     KIND                 STATUS    URL
# grafana                  MCPServer            Running   http://mcp-grafana-proxy:8080
# github                   MCPServer            Running   http://mcp-github-proxy:8080
# linear                   MCPRemoteProxy       Running   http://mcp-linear-proxy:8080
# platform-tools-vmcp      VirtualMCPServer     Running   http://mcp-vmcp-proxy:9090
VirtualMCPServer is where fleet management pays off
One endpoint, one auth config, one place to add or remove backends. When you add a new MCP server to the fleet, you add a line to the VirtualMCPServer spec and the agent picks it up automatically. No client reconfiguration, no new connection management.
GitOps-ing the fleet with ArgoCD
Because MCPServer resources are just Kubernetes manifests, they fit naturally into a GitOps workflow. Here's an ArgoCD Application that syncs your entire MCP fleet from a directory in your platform config repo:
apiVersion: argoproj.io/v1alpha1
kind: Application
metadata:
  name: toolhive-mcp-fleet
  namespace: argocd
spec:
  project: default
  source:
    repoURL: https://github.com/your-org/platform-config
    targetRevision: main
    path: mcp-servers/
  destination:
    server: https://kubernetes.default.svc
    namespace: platform-tools
  syncPolicy:
    automated:
      prune: true
      selfHeal: true
Add a new MCP server by creating a YAML file in mcp-servers/, committing it, and waiting for ArgoCD to sync. The PR is the audit trail. The Git history is the change log. That's how it should work.
Horizontal scaling
When a single backend pod isn't enough — high-concurrency tools, CPU-heavy MCP servers — MCPServer supports independent scaling of the proxy runner and the backend:
spec:
  replicas: 2        # proxy runner pods
  backendReplicas: 3 # MCP server backend pods
  sessionStorage:
    provider: redis
    address: redis.platform-tools.svc.cluster.local:6379
    keyPrefix: toolhive-sessions
    passwordRef:
      name: redis-password
      key: password
Frequently asked questions
Does the ToolHive operator handle auth, or is that still my problem?
The operator's proxy layer handles auth — OIDC token validation, scope checking, rate limiting, and audit logging. You configure it via MCPOIDCConfig (for OIDC) or MCPExternalAuthConfig (for token exchange with a backend auth server). You don't write auth code in your MCP server implementations. If you've already got OIDC set up for your Kubernetes workloads (Entra ID, Keycloak, Dex), the same configuration applies here.
We already use ESO/Vault for secrets across the cluster. Does ToolHive work with that?
Yes, and the integration is transparent. ESO syncs your external secret into a Kubernetes secret. ToolHive's secrets block references that Kubernetes secret and injects it as an env var into the MCP server pod. Your MCPServer YAML looks the same whether the secret originally came from AWS Secrets Manager, Vault, or a kubectl create secret. No ToolHive-specific secret management to learn.
What's the difference between MCPServer and MCPRemoteProxy?
MCPServer runs a containerised MCP server inside your cluster — the operator manages the container, its lifecycle, and its pod networking. MCPRemoteProxy creates a proxy pod that fronts an MCP server running outside your cluster (a SaaS endpoint, an API you don't control). Both get the same auth and audit layer from the ToolHive proxy. The choice comes down to where the MCP server actually executes.
Is this production-ready?
The operator API is v1beta1 as of May 2026. That's meaningful progress from the alpha state it was in earlier this year — the API is reasonably stable and the project is actively maintained by Stacklok. That said, v1beta1 means breaking changes are still possible between minor versions. Pin your chart versions, read the release notes before upgrading, and check the migration guide when you bump. Treat it the way you'd treat any v1beta1 Kubernetes API.
How does this compare to just writing the auth layer myself?
The hand-rolled approach (see MCP in the Real World) gives you complete control and no operator dependency. The ToolHive operator gives you the same capabilities without writing code — and critically, you only configure auth once (on the VirtualMCPServer or operator), rather than per server. For teams running more than two or three MCP servers, the operator model pays off quickly. For a single personal server, the CLI is probably enough.
What you're actually getting
Running MCP servers without an operator means maintaining the security layer in code — auth, RBAC, secret injection, audit logging — for every server you add. ToolHive gives you that layer as Kubernetes primitives that live in Git alongside your other workload definitions.
Your MCPServer manifests get PRs. They get code review. They get reconciled by ArgoCD. When something goes wrong, you look at the same audit logs, the same pod logs, the same kubectl describe output you'd use for any other workload. MCP servers stop being special cases and become part of the platform.
For the application-level security patterns that complement the operator — JWT validation, per-tool permission scoping, prompt injection defences — those code patterns from MCP in the Real World still apply if you need defence in depth at the tool layer.
Companion resources
The companion repo has the full fleet configuration, install script, and example MCPServer manifests for GitHub, Kubernetes, and OSV servers with a VirtualMCPServer aggregating all three.
→ toolhive-operator example + install script
# Install the operator and deploy a starter fleet
NAMESPACE=platform-tools \
GITHUB_PAT=<your-token> \
./scripts/toolhive/install.sh
Further reading
- ToolHive Kubernetes Operator docs — complete reference, updated actively
- ToolHive on GitHub — source, operator examples, CRD reference
- MCP in the Real World — application-layer security patterns that pair with this
- AI-Driven GitOps with MCP and Argo CD — MCP operations patterns at scale