
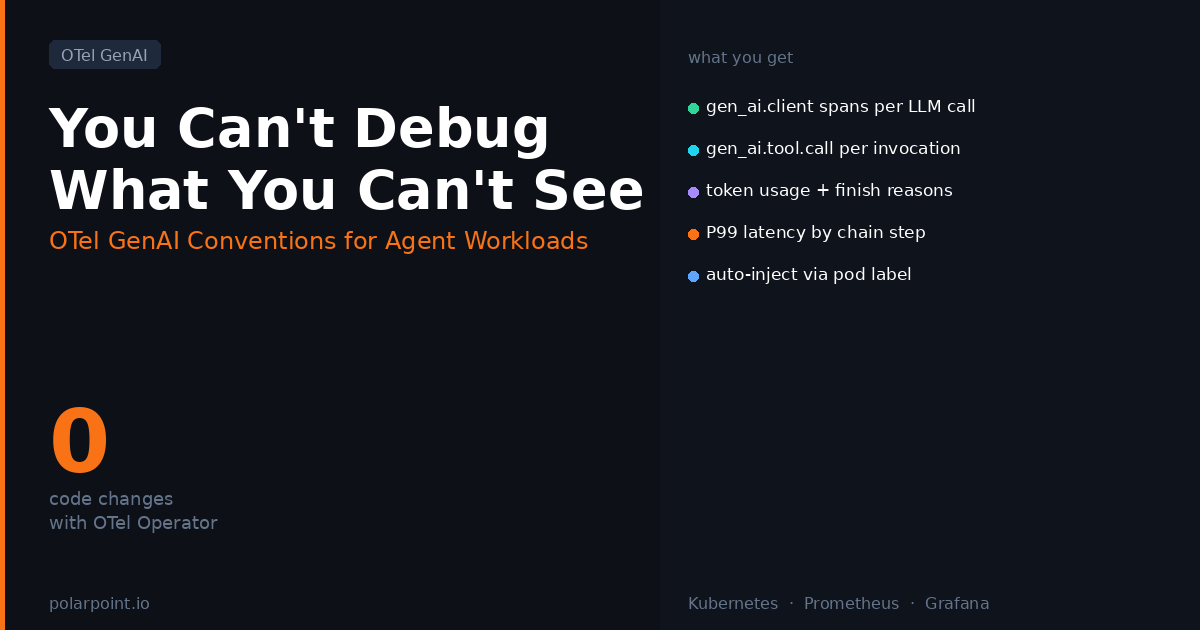
You Can't Debug What You Can't See: OTel GenAI Conventions for Agent Workloads
A model call fails silently. Your agent stops mid-chain and returns an empty result. The logs show an HTTP 200. You have no idea which tool call caused it, what the model was given, how many tokens it burned, or where the latency actually went. This is what most teams running agents in production are dealing with right now. OpenTelemetry's GenAI semantic conventions are the fix — and the OTel Operator for Kubernetes means you can get this instrumentation without touching application code.

What HTTP 200 hides
The model returns HTTP 200. Your agent stops mid-chain and returns an empty result. The logs show nothing wrong. You have no idea which tool call caused it, what the model was given, how many tokens it burned, or where the latency actually went. HTTP 200 tells you the transport succeeded. It tells you nothing about whether the model hit a context limit, chose the wrong tool, or returned a truncated completion. GenAI semantic conventions fill that gap.
Quick takeaways
- The OTel GenAI semantic conventions define standard span types, attribute names, and metric names for LLM client calls, agent operations, tool invocations, and RAG retrieval steps
- LLM client spans (
gen_ai.client) are stable as of early 2026; agent and framework spans (gen_ai.agent) are experimental but stable in practice - The OTel Operator for Kubernetes can auto-inject GenAI instrumentation into selected pods via label selectors — no code changes required
- The key attributes you actually care about:
gen_ai.request.model,gen_ai.usage.input_tokens,gen_ai.usage.output_tokens,gen_ai.response.finish_reasons, andgen_ai.operation.name - A full agent reasoning chain produces a parent span per agent invocation with child spans per LLM call, per tool call, and per retrieval step — giving you the complete trace
The observability gap in agent workloads
When you instrument a web service with OTel, you get spans for HTTP requests, database queries, cache hits. That tells you where time went in the infrastructure. For an agent, that's not enough — and the gap matters more than people expect until they hit it.
Standard HTTP tracing shows you that your agent container made an outbound POST to api.anthropic.com and got a 200 back in 3.2 seconds. It doesn't tell you what the model was given, what it returned, which tool it chose to call, what that tool returned, whether the finish reason was stop (normal) or length (context window hit) or content_filter (something was blocked). It doesn't tell you that the model was given 47,000 tokens of context on the third invocation because a retrieval step returned a 40,000-token document, and that's why the P99 latency is what it is.
Without GenAI-specific tracing, "the agent is slow" is undebuggable. "The retrieve_runbook tool call returned 4,000 tokens and caused the model to exceed its context window on the summarisation step" is actionable. That distinction is the whole point of the GenAI semantic conventions.
You need to know:
- Which model was called, with which parameters?
- What was the input prompt and (optionally) the completion?
- How many tokens were consumed — and what did that cost?
- Which tool did the model choose to call, and what did it return?
- Where in the reasoning chain did latency spike or the model give up?
The conventions give you a standard answer to all of these, across every provider and every framework, in a form your existing OTel pipeline already knows how to handle.
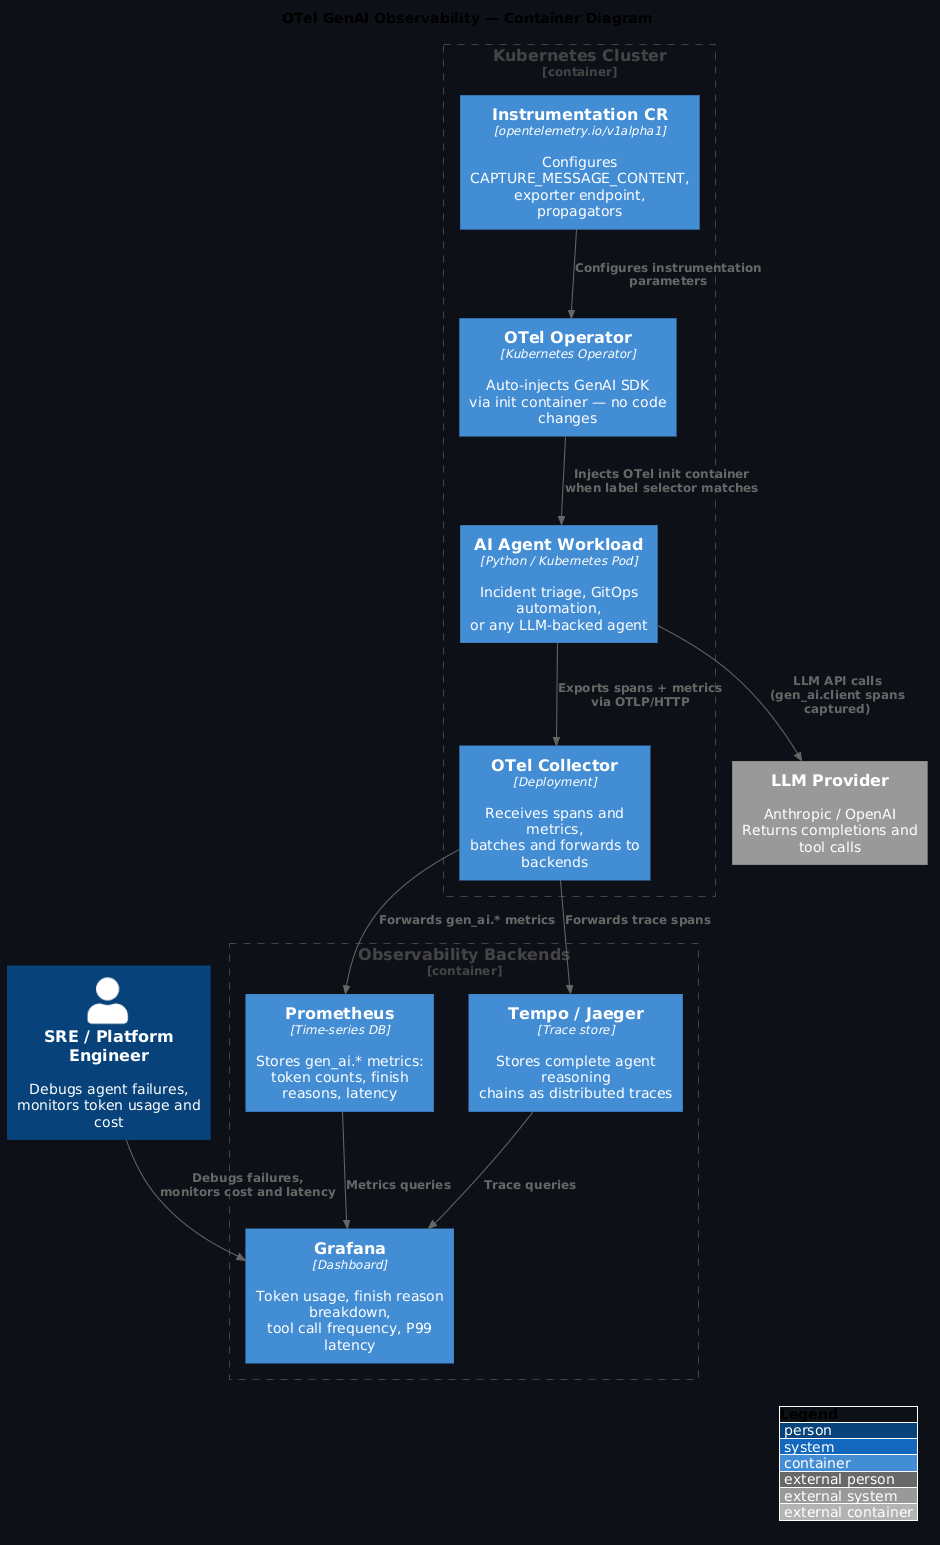
The span hierarchy
A typical agent invocation with tool use produces this trace shape:
agent.invoke (gen_ai.operation.name=invoke_agent)
├── gen_ai.client (model=claude-sonnet-4-6, operation=chat)
│   ├── gen_ai.tool.call (tool=get_pod_status)
│   │   └── [tool execution span — your MCP call or function]
│   └── gen_ai.tool.call (tool=get_recent_events)
│       └── [tool execution span]
└── gen_ai.client (model=claude-sonnet-4-6, operation=chat)
    [final synthesis call]
The parent agent.invoke span ties the whole reasoning chain together. You can see the full trace in one view: how many LLM calls the agent made, which tools it chose, whether any tool calls were slow, and which model call is responsible for most of the latency.
Each gen_ai.client span represents one round-trip to the model. If your agent loops — calling the model, using a tool, calling the model again with the result — each loop iteration is a separate gen_ai.client span under the same parent agent span. That's how you see "this agent made seven model calls to resolve this incident" and start asking whether that's expected or a reasoning loop.
The attributes that matter
On every LLM call span:
| Attribute | What it tells you |
|---|---|
gen_ai.request.model |
Which model version was actually called — critical if you have fallback logic or multiple providers |
gen_ai.usage.input_tokens |
Prompt token count — tracks context bloat over time |
gen_ai.usage.output_tokens |
Completion tokens — correlates with latency and cost |
gen_ai.response.finish_reasons |
stop, length, tool_calls, content_filter — length means you hit the token limit; content_filter means something was blocked |
gen_ai.request.max_tokens |
What limit you set — compare with output tokens to see how close you came to truncation |
On agent spans:
| Attribute | What it tells you |
|---|---|
gen_ai.operation.name |
invoke_agent, create_agent — lets you filter agent operations specifically |
gen_ai.agent.name |
Which agent was invoked — useful in multi-agent setups |
On tool call spans:
| Attribute | What it tells you |
|---|---|
gen_ai.tool.name |
The tool the model chose — spot which tools get called most (or never) |
gen_ai.tool.call.id |
Correlates the tool call with the model's response |
Getting it on Kubernetes without code changes
The OTel Operator for Kubernetes supports auto-injection of GenAI instrumentation via pod label selectors. The operator injects an init container that wraps the relevant SDK calls, so your agent code doesn't need to import OTel directly.
# Deploy the OTel Operator (if not already installed)
kubectl apply -f https://github.com/open-telemetry/opentelemetry-operator/releases/latest/download/opentelemetry-operator.yaml

---
# Create an Instrumentation CR for GenAI workloads
apiVersion: opentelemetry.io/v1alpha1
kind: Instrumentation
metadata:
  name: genai-instrumentation
  namespace: platform-agents
spec:
  exporter:
    endpoint: http://otel-collector.monitoring.svc.cluster.local:4318
  propagators:
    - tracecontext
    - baggage
  python:
    env:
      - name: OTEL_PYTHON_LOGGING_AUTO_INSTRUMENTATION_ENABLED
        value: "true"
  env:
    - name: OTEL_INSTRUMENTATION_GENAI_CAPTURE_MESSAGE_CONTENT
      value: "false"  # see note below
# Add label to your agent deployment to opt in
apiVersion: apps/v1
kind: Deployment
metadata:
  name: incident-triage-agent
  namespace: platform-agents
spec:
  template:
    metadata:
      labels:
        app: incident-triage-agent
        instrumentation.opentelemetry.io/inject-python: "genai-instrumentation"
    spec:
      containers:
        - name: agent
          image: platform/incident-triage-agent:0.4.0
The PII decision you must make before enabling content capture
Setting OTEL_INSTRUMENTATION_GENAI_CAPTURE_MESSAGE_CONTENT to true puts every prompt and completion into your trace store. If your agents touch support tickets, runbooks with credentials, or anything containing user data, that data is now in your observability backend. Turn this off in production if agents handle PII. Enable it in dev or staging where you control trace backend access. The OTel spec calls this out as an operator-level decision for exactly this reason.
The CAPTURE_MESSAGE_CONTENT decision is the most important one you'll make. Setting it to true gives you full prompt and completion content in your traces — invaluable for debugging a reasoning failure where you want to see exactly what the model was given and what it said. But it means every LLM input and output flows into your trace store. If your agents touch support tickets, runbooks with credentials, or anything that could contain PII, turn this off in production and only enable it in dev or staging environments where you control access to the trace backend. The OTel spec calls this out explicitly as an operator-level decision for exactly this reason.
What the dashboards look like
With the GenAI spans flowing into your collector and on to Prometheus and Grafana, a few dashboards become immediately useful:
The four dashboards that matter
Token usage over time (catch context bloat early), finish reason breakdown (a rising share of length means truncation you don't know about), tool call frequency heatmap (unused tools bloat your system prompt; high-frequency tools are caching candidates), and P99 latency by chain step (waterfall view to find the one slow tool call causing your outliers).
Token usage over time. gen_ai.usage.input_tokens and gen_ai.usage.output_tokens as time-series by model and agent name. This is how you catch context bloat — input tokens creeping up week-on-week means your system prompt or tool results are growing and it's only a matter of time before latency follows.
Finish reason breakdown. A pie chart of gen_ai.response.finish_reasons per agent. A rising share of length finishes is a warning sign: your prompts are hitting the context limit, the model is truncating its response, and you probably don't know it because the HTTP status was 200.
Tool call frequency heatmap. gen_ai.tool.name call counts by agent. Tools that are never called are bloating your system prompt for nothing — remove them. Tools that are called on almost every invocation are candidates for caching.
P99 latency by chain step. Waterfall view of the agent span tree. This is where you find the actual culprit in a slow agent — usually one tool call that occasionally returns a large payload and causes the next LLM call to take 8 seconds.
# Average input tokens per agent invocation, by agent name
avg by (gen_ai_agent_name) (
  increase(gen_ai_usage_input_tokens_total[5m])
  / increase(gen_ai_client_requests_total[5m])
)

# Rate of non-stop finish reasons (truncation or safety blocks)
rate(gen_ai_client_requests_total{gen_ai_response_finish_reason!="stop"}[5m])
How this fits the broader stack
If you're running HolmesGPT for incident triage, GenAI semconv is how you get its internal reasoning data into your existing OTel pipeline rather than a separate observability silo. Every root cause analysis HolmesGPT performs is a chain of model calls and tool invocations — with proper tracing you can see exactly why it reached a particular conclusion.
If you have Claude agents calling the ArgoCD MCP server, each argocd_mcp.list_applications call should appear as a gen_ai.tool.call span under the parent agent span. That's how you see "the agent called ArgoCD twelve times in a single invocation" and understand whether that's by design or a reasoning loop.
OTel Operator makes this GitOps-native
The Instrumentation CR is just another GitOps artefact. Put it in your platform repo, version it, review changes in PRs. The same AGENTS.md conventions you apply to your platform repo cover it. Instrumentation configuration that lives in Git is instrumentation configuration that gets reviewed, audited, and rolled back like any other infrastructure change.
And if you're managing the OTel Operator with Flux or ArgoCD, the Instrumentation CR is just another GitOps artefact. Put it in your platform repo, version it, review changes in PRs. The same AGENTS.md conventions you apply to your platform repo cover it.
What you get
- Full trace of every agent reasoning chain — which model, which tools, how many tokens, where the time went
- Finish reason monitoring catches context limit issues before users notice
- Token usage metrics feed cost attribution per agent per team
- Zero code changes for Python agents if you use the OTel Operator auto-injection
FAQ
Does this work with non-Python agents?
The OTel Operator auto-injection currently supports Python and Java. For Go or Node.js agents, you'll need to import the OTel SDK and the relevant GenAI instrumentation library directly. The attribute names and span shapes are identical — the only difference is how the instrumentation gets wired in.
How do I handle multi-provider setups?
The gen_ai.system attribute identifies the provider (anthropic, openai, google_vertexai). You can filter by it in Grafana to compare latency, cost, or finish reason distributions across providers. If you have fallback logic that switches providers on failure, tracing makes the fallback behaviour visible — you'll see gen_ai.system=openai spans appearing on the requests that hit the fallback path.
What about RAG retrieval steps?
The conventions include gen_ai.retrieval spans for RAG workloads, covering the vector search step and the document chunks returned. These are still experimental but usable. The most valuable attribute is gen_ai.retrieval.documents — it lets you see which chunks were retrieved and correlate large retrieval payloads with downstream context limit problems.
Is there a cost to capturing all this telemetry?
Yes, and it's worth profiling. The main overhead is prompt/completion content if you enable CAPTURE_MESSAGE_CONTENT — a 4,000-token LLM response is a large string to serialise, send to the collector, and store. Token counts, finish reasons, and tool call names are small and cheap. A reasonable default is to capture everything except prompt/completion content in production, and enable full capture in a staging environment where you can afford the storage and have stricter access controls.
Sources: - OTel GenAI semantic conventions — spans - OTel GenAI agent spans - OTel GenAI metrics conventions - Inside the LLM Call — OTel blog 2026 - Grafana: zero-code GenAI observability on K8s